Posts filed under ‘Green Manufacturing’
Strategic Leadership –What’s Your Style?
Strategic Leadership is the ability of influencing others to voluntarily make decisions that enhance the prospects for the organization’s long-term success while maintaining long-term financial stability.
How to Achieve Operational Excellence
Part 1 of 2: Understanding Operational Excellence
Operational Excellence is the foundation of business growth, profitability and competitive advantage. An organization can only begin to forge new growth strategies and business models after it has developed a mature capacity for managing its current business operations effectively and efficiently in the course of meeting the needs of its customers/stakeholders as no one can grow a profitable business on an unsecured foundation.
 Based on the criteria of the Malcolm Baldrige National Quality Award, Operational Excellence must be demonstrated by results, not just by words. About half of the 1,000 points associated with the Baldrige award are results focused. In order to maximize the degree to which these 450 points are attained, an organization must show sustained improvement over time, in all areas of importance, against ‘best in class’ organizations.
Operational Excellence is therefore demonstrated by results that reflect sustained improvement over time, improvement in all areas of importance (both performance areas and segments within each area), and performance at a level that is at, or superior to, ‘best in class’ organizations. Common areas of importance for a cost center are safety, quality, people, and cost. Profit centers add the revenue generation performance, processes, and information and technology areas to this mix. Common segments within each performance area include employee groups, facilities, departments, and external customer types. Organizations today are seeking to be operationally excellent for three key reasons: costs, customers, and competitors. They are continuously seeking the best ways to achieve operational excellence (lower costs, improve flexibility and speed to market, quality and reliability, and customer/stakeholder satisfaction and value. By effectively analyzing and managing operations, organizations can produce the right products with the right features at the right cost.
Part 2 of 2: Achieving Operational Excellence, to be continued…
Question: Does your organization have Operational Excellence initiatives in place?
Lean Manufacturing: Eliminating the 8 Hidden Wastes – Part 8 of 8. The E in DOWNTIME
 Excess processing is doing anything more than the minimum required to transform material into an acceptable product. It is effort that adds no value to the service or product from the customer’s viewpoint. After all, it is the customer, either internal or external, that needs to be satisfied. Clarifying customer requirements and changing the manufacturing or service orders causes different costs. If caught too late, this leads to re-work or even the rejection of shipped goods. This includes processing beyond customer values or taking extra steps that are not required. Whatever the cause, the result is predictable: wasted money, time, effort and resources. The only option is to closely examine the processes and correct them without sacrificing quality.
LOOK FOR poor process control, lack of standards, lack of or poor communication, overdesigned equipment, undefined true requirements, human error, redundant approval or inspection, non-standard business processes, re-entering data, just-in-case logic, “Not Invented Here and / or “Not My Job” syndromes, lack of teamwork or lack of adequate training.
REDUCE BY using Lean tools such as Value Added Flow Charts, Statistical Process Control (SPC), 5-Why Analysis, A3 Reports and Total Productive Maintenance.
The Value-Added Flow Chart is a tool to improve cycle times and productivity by visually separating value-adding from non-value-adding activities. Value Added Flow Charts give teams vision into where processes are creating value and where potential improvement efforts should be targeted. The charts are effective at showing current state and improvements resulting from projects. Teams can understand the value of process steps and identify waste in various forms. This tool is the cornerstone of any process improvement toolbox.
Statistical Process Control (SPC) is based on the analysis of data and requires, like any program, support from the top, and a great deal of coordination. If done successfully SPC can greatly improve a process’s ability to be controlled and analyzed during process improvement projects. The process will be most effective if senior managers make it part of their daily routine to review charts and make comments. Some practitioners share initial charts when they review them to provide visual support. Charts that are posted on the floor make the best working tools-they are visible to operators, and are accessible to problem-solving teams. While the initial resource cost of SPC can be substantial, the ROI gained from the information and knowledge the tool creates proves to be a successful activity time and time again.
The 5-Why Analysis method is used to move past symptoms and understand the true root cause of a problem. It is said that only by asking “Why?” five times successively can you delve into a problem deeply enough to understand the ultimate root cause. By the time you get to the 4th or 5th why, you will likely be looking squarely at management practices. This methodology is closely related to the Cause and Effect (Fishbone) diagram and can be used to complement the analysis necessary to complete a Cause and Effect diagram. 5-Why analysis is more than just an iterative process or a simple question asking activity. The purpose behind a 5-why analysis is to get the right people in the room to discuss all of the possible root causes of a given defect in a process. Many times teams will stop once a reason for a defect has been identified. These conclusions often do not get to the root cause. A disciplined 5-why approach will push teams to think outside the box and reach a root cause where the team can actually make a positive difference in the problem instead of merely treating symptoms.
A3 Reports are one page reports used for documenting the necessary information needed for progress reporting and decision making. They simplify project reporting because they pull from otherwise numerous and detailed progress reports and extensive background analysis. A3 reports condense the information to a single page and visually communicate to the reader using graphs, charts and succinct bullet points. Also referred to as “1 pagers”, the A3 report got its name from Toyota Motor Company and refers to the metric paper size that the report is produced on (equivalent to a paper size of 11 inches by 17 inches). This report can be characterized as a Lean tool best suited for solving relatively short duration Kaizen improvement activities. An A3 Report is comparable to today’s computerized “dashboard”.
Total Productive Maintenance (TPM) was developed in the 1970’s as a method of involving machine operators in the preventive maintenance of their machines. This was a reaction to increasing specialization and centralization of the maintenance function that had crated division of labor barriers between operators and the maintenance of their machines and equipment. TPM involves both the operators and maintenance crews working together to improve the overall operation of the equipment. The operators are around the equipment all of the time and should be the first to identify noisy or vibrating motors, squeaky fan belts or chains and oil and air leaks. Operators need to understand the basic standards for their equipment and check it closely and routinely to assure it meets those standards. As soon as a minor defect in operation is identified, maintenance needs to be notified. Catching problems early and fixing them is the key to preventing catastrophic failure or complete shutdown of expensive equipment. Equipment reliability is a cornerstone of a lean manufacturing system. With little or no buffer inventories, equipment failures directly impact production volumes and customer service; therefore, effective preventive maintenance is a critical activity. By bringing together people from all areas concerned with equipment into a comprehensive PM system, overall equipment effectiveness (OEE) is raised to the highest possible level. This requires the support and cooperation of everyone from top management on down.
How much profit is your company losing due to non-value added processing activities?
Watch for upcoming articles on Lean Manufacturing and the remaining Hidden Wastes of DOWNTIME…
Lean Manufacturing: Eliminating the 8 Hidden Wastes – Part 7 of 8. The M in DOWNTIME
 Motion waste is the unnecessary movement of people, product or equipment that adds no value to a process. Workers walk back and forth from the work area to supply, around unneeded equipment or perform redundant motions that can be eliminated to speed up a process. This can be one of the most frustrating wastes for workers and management. The lost time and production rob most processes of opportunities to function efficiently and make the employees work harder. While most processes are not designed to have motion wastes in them, it is one of the first wastes to creep in and cause disruption.
LOOK FOR excessive walking, moving or handling.
REDUCE BY developing and then examining a spaghetti diagram and Current State and Future State Value Stream Map (VSM) of every process to fully understand operator, equipment or material movement. Implement a Standard Work Practices program and develop an Overall Equipment Effectiveness (OEE) record.
A Spaghetti diagram is a simple visual tool to demonstrate the flow of material, flow of information, and flow of money in a process, and is used to expose waste AND opportunity. The word “spaghetti” is descriptive because it describes flow that is not easily understood, cannot easily be followed, or if the flow is literally all over the place. It represents a point of departure, that is, what does the current state look like and what are the exact improvements needed to be made. Put another way, a spaghetti diagram is a visual representation of how bad things really are. Sometimes, through, poor thinking and poor choices, they are not just representations of how things are, but they can be representations of what we have created; sometimes we turn our processes into spaghetti diagrams. Remember, the spaghetti diagram process is not just completing a diagram but using it to fuel decisions that will improve the workplace. Ensure that operators are involved in the activity. In the results, look for large distances and repetitive movements; consider why they are made and what can be done to improve. Optimizing the workplace can only be carried out when its weak points are known.
Value Stream Mapping (VSM) is documenting an overhead view of a process that looks all the way from the finished product back through a process to the raw materials or request for action (information) which is where most processes start. VSM can help to clearly understand and communicate all of the steps in a process and also allows you to identify those hidden wastes that exist within a process. From the raw materials storage to delivery of a finished product or service, materials flow throughout a process and are handled many people and machines. Information also flows all the way from initial request for a product or service through to the customer reception of the product or service. Historically, most flow charting or mapping processes did not include this crucial element called information flow. VSM not only includes information flow, but also shows how it is intertwined with material flow, machines and manpower.
Standardized Work Practices allow process steps to be decomposed and optimized into simple easy to follow steps that any operator can easily perform. Standardized practices allow operators and workers to perform tasks the same way each time by combining and using all resources effectively such as time, technology, tools on shadow boards and raw materials. By breaking down any process into clearly defined tasks, one can achieve consistency and increase throughput and OEE. These standard tasks or sequence of tasks should be well measured and documented into Standard Operating Procedures (SOP) and simpler tasks or standards developed into one point lessons, which form the basis for training new operators in performing a task and as a performance and quality measurement tool.
Overall Equipment Effectiveness (OEE) is a method of measuring productivity performance. More specifically, it is a statistical metric to determine how efficiently a machine is running. The four bits of information required to calculate OEE are total staff time and the machine’s efficiency, quality and availability. The result is the value that a machine contributes to the production process. OEE is a globally recognized best practice measure to systematically improve processes for higher efficiencies and better productivity, ultimately leading to lower manufacturing costs and higher profitability. It is frequently used as a key metric in a Total Productive Maintenance (TPM) program.
Are Motion Wastes walking away with your customer’s and your company’s profits?
Watch for upcoming articles on Lean Manufacturing and the remaining Hidden Wastes of DOWNTIME…
Lean Manufacturing: Eliminating the 8 Hidden Wastes – Part 6 of 8. The I in DOWNTIME
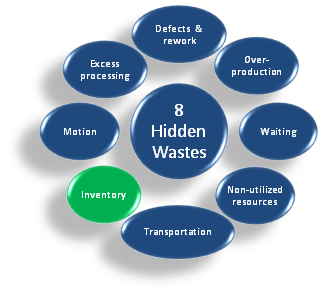 Inventory waste is any material in excess of the one piece required for the next step in the process and can be found in any of three states-raw materials, work-in-progress, and finished goods. Unless the product is being worked on and having value added to it, or it is on its way to the customer, it is inventory. Excess inventories hide many unwanted conditions. Excessive inventory may cover up quality problems like rework and defects, manpower and/or production scheduling problems, excessive lead times and supplier or vendor problems. It is very expensive to carry excessive inventory which requires capital to be tied up in interest payments. Excessive inventory reduces ROI on manpower and raw materials.
LOOK FOR inventory held “just-in-case” problems arise, or unreliable shipments from suppliers or for excessive service capability or excessive inventories with less than 12 turns per year. Also look for large lot production, unreliable forecasts, poor scheduling, poor market forecasts, unbalanced workloads, poor communications and management decision issues any of which result in increased labor, fuel, space and/or maintenance costs and material aging and risk of obsolescence.
REDUCE BY implementing Just-In-Time (JIT) movement of materials, Single Piece Flow, kanbans, 5S, and cellular layouts.
Just-in-time manufacturing is a strategy used to reduce costs by reducing the in-process inventory level. It is driven by a series of signals that tell the production line to make the next piece for the product and when it is needed. The signals used are usually simple visual signals, such as the absence or presence of a piece that is needed in the manufacturing process. In just-in-time manufacturing, reorder levels for certain inventory items are set and new stock is ordered only when those levels are reached. There is no overstocking of parts or items, which saves on space in the warehouse. This manufacturing strategy can lead to improvements in quality and efficiency. It also can lead to higher profits and a larger return on the company’s investment. Although this specific manufacturing strategy was created by the Toyota company in Japan during the 1970s, previous businesses used manufacturing processes that were based on similar concepts. One of the first was created by Henry Ford, whose automobile company bought materials only for its immediate needs in the manufacturing process. Ford bought only the amount of material that was needed in the production plan and planned the transportations of materials so that the flow of the product would be smooth. This created a rapid turnover and decreased the amount of money that was tied up in raw materials.
The Single Piece Flow technique allows us to make only the quantity needed to fill the hole to be “pulled” by the next operation downstream from their operation. This keeps the work-in-progress to a minimum and is usually managed with a good kanban system. Often movement of batches are minimized to the smallest number efficiently handled and eventually further reduced to Single Piece Flow.
Kanban is a scheduling system that uses signals to help determine what to produce, when to produce it, and how much to produce. It is not an inventory control system. It works from upstream to downstream in the production process (i.e., starting with the customer order). At each step, only as many parts are withdrawn as necessary, ensuring that only what is ordered is made. The necessary part in a given process step always accompanies the signal to ensure visual control. The upstream processes only produce what has been withdrawn. This includes only producing items in the sequence in which the signals are received, and only producing the number indicated. Only the products that are 100% defect free continue on through the production line. In this way, each step uncovers and then corrects the defects that are found, before any more can be produced. The number of signals should be decreased over time. Minimizing the total number of signals is the best way to uncover areas of needed improvement. By constantly reducing the total number of signals, continuous improvement is facilitated by concurrently reducing the overall level of stock in production.
The 5S system is a workplace organization method that greatly improves the efficiency and management of an operational area while improving morale and saving time. The five S’s stand for Sort, Set-in-order, Shine, Standardize and Sustain. 5S is often the first step in applying Lean techniques. It helps to get all of the “junk”, including materials, out of the work area and then set procedures to keep it that way.
In Cellular Layouts, production work stations and equipment are arranged in a sequence that supports a smooth flow of materials and components through the production process with minimal transport or delay. Implementation of this lean method often represents the first major shift in production activity, and it is the key enabler of increased production velocity and flexibility, as well as the reduction of capital requirements.
Are excess inventories tying up your cash, creating financial inflexibility and costing your company money?
Watch for upcoming articles on Lean Manufacturing and the remaining Hidden Wastes of DOWNTIME…
Lean Manufacturing: Eliminating the 8 Hidden Wastes – Part 5 of 8. The T in DOWNTIME
 Transportation waste occurs when people, product, equipment or information are moved more often or further than needed. During multi-step processes, materials and people are moved from process to process that are separated by distance and/or time. Instead of processes being sequential or positioned next to each other, they are far apart and require forklifts, conveyors or other moving devices to be re-positioned for the next step in a process. All of these movements add no value to the process or product.
LOOK FOR the movement of people, materials or information that does not add value to a process.
REDUCE BY minimizing the physical distances the materials, equipment and/or manpower travel with zoning, cellular layouts, value stream mapping, and sequencing.
Zoning is a technique of identifying the boundaries of a particular work center. Everything has a marked home and there is no excess work-in-process storage. When Just-in-Time (JIT) is fully implemented, equipment and personnel are optimized in new layouts. Techniques like frontal loading, retrieval and ergonomically correct work centers are implemented. Place supply and removal paths at least 1 meter away from the back of workers and make the paths at least 2 meters wide to reduce potential accidents. Some organizations establish parts “super markets” to locate materials near to where they will be needed and operators will “pull” materials into their work center, versus having work “pushed” to them.
A Cellular Layout should provide all of the equipment, tools, work instructions and materials to accomplish a single task or group of related tasks. It does not matter if the cell shape is a T, I, L, U or V, although the U is the most common. The best shape is the one that produces the most efficient productivity in a safe manner. Most people are right handed, so the most ergonomically correct flow of parts or objects in a cellular layout is counter-clock wise. Arrange production cells to minimize the stretching and reaching for parts, supplies or tools and to accomplish tasks. Place the height of the work surface based on the type of work to be done and the weight of the materials to be moved. Observe and talk to workers doing the task before determining the final layout.
Value Stream Mapping (VSM) is documenting an overhead view of a process that looks all the way from the finished product back through a process to the raw materials or request for action (information) which is where most processes start. VSM can help to clearly understand and communicate all of the steps in a process and also allows you to identify those hidden wastes that exist within a process. From the raw materials storage to delivery of a finished product or service, materials flow throughout a process and are handled many people and machines. Information also flows all the way from initial request for a product or service through to the customer reception of the product or service. Historically, most flow charting or mapping processes did not include this crucial element called information flow. VSM not only includes information flow, but also shows how it is intertwined with the flow of materials, machines and manpower.
Sequencing is a JIT technique which was revolutionized the Toyota Production System in which they scheduled their automobile manufacturing for mixed model production. Their implementation of Lean techniques allows them to effectively produce the correct model of automobile with variations needed to meet the changing customer demands. Similar models that require different parts are scheduled for production with the right parts delivered to the production line just-in-time. These techniques can be applied to any production line that produces similar items and knows the frequency of their customer demands. There is no need to tell customers that they have to wait until you complete a long production run of one type of product before you can produce a similar one. Operations that are process-focused versus function-focused, with smaller machines and well trained operators are usually flexible enough to use sequencing. In today’s market, customers do not want to wait for their product while your competition is producing goods when the customer wants it.
Is transportation waste creating bottlenecks and roadblocks that are hindering the financial success of your customers and your company?
Watch for upcoming articles on Lean Manufacturing and the remaining Hidden Wastes of DOWNTIME…
Lean Manufacturing: Eliminating the 8 Hidden Wastes – Part 4 of 8. The N in DOWNTIME
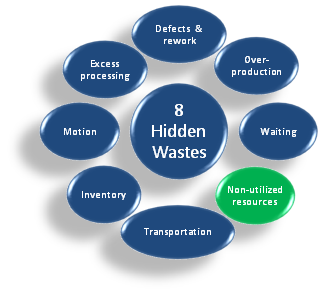 Non-utilized resources waste is sometimes referred to as an additional waste. It is not one of Taiichi Ohno’s original seven forms of muda identified in the Toyota Production System, but its potential to drain value from processes is tremendous. Waste from non-utilized resources typically refers to a failure to utilize the full potential of people in a team or organization, but it can also refer to the failure to use any sort of resource effectively, whether the resource is tangible or intangible, human or non-human. Tangible resources that are not used to their full potential are obvious forms of waste in the supply chain. Assets are associated with measurable costs that can be calculated to determine the specific results from underutilized assets or even assets that lie dormant for extended times. Intangible resources are sometimes harder to measure but can be equally costly. The waste of human resources can also take multiple forms. It can be costly to fail to utilize the full creativity and talent of people throughout the team or organization. When creative ideas and solutions remain untapped, the opportunity cost – the benefits that are foregone as a result – can be virtually impossible to measure. The wasted potential for improvement results when people doing the work are not involved and consulted for ideas on improving the methods and processes of the work.
LOOK FOR old guard thinking, politics and business culture, and no or low investment in training.
REDUCE BY eliminating worker’s “check your brain at the door mentality”. Tap into and embrace the thoughts, ideas and intelligence of the persons performing the work, and require that level of involvement as part of the daily business culture. Implement balanced scorecards for measuring performance and create a visual workplace. Brainstorming sessions, idea gathering techniques, team work, training, and clear leadership are required to begin to involve all employees in the company’s drive towards perfection; for continuous improvement to succeed there must be welcomed involvement by each and every employee. Encourage people to take ownership of their areas, processes and products to promote a sense of pride and involvement. Employees must always be considered the company’s biggest asset and leadership should respect them, nurture them, and involve them in the business. Those companies that do so will create a competitive advantage and reap the rewards.
A Balanced Scorecard (BSC) is a strategic management tool that measures how well the business activities are aligned with the organization’s strategic vision. It balances financial results with non-financial performance metrics. The novelty of the Balanced Scorecard is the addition of non-financial metrics. It is also a management system, not just a measurement tool, in that it helps to clarify vision and to translate strategy into activity.
A Visual Workplace is not about buckets and brooms or about posters, signs, and lines on the floor. It is a compelling operational imperative, central to the war on waste, vastly reduced lead times, and an accelerated flow of material, people, and information in and through the workplace. Visuality is first and foremost a language; the language of the company’s operational approach, optimized through visual devices and systems. This language translates vital information into visual displays as close to the point of use as possible, thereby making it possible to recognize the pattern of work without speaking a word. A visual workplace is populated by the many visual devices invented by a workforce that knows how to think visually. Visual thinking is a person’s ability to recognize motion and the information deficits that trigger it, and, then, to eliminate both through solutions that are visual. One of the main by-products of effectively implemented visual workplace is the emergence of a new core competency – employees who know how to think visually, and a workforce of visual thinkers is the way to true visual management in any company.
Is your company leadership reaping the maximum rewards of sustained financial success by harnessing the intelligence, skills and experience of all employees?
Watch for upcoming articles on Lean Manufacturing and the remaining Hidden Wastes of DOWNTIME…
Lean Manufacturing: Eliminating the 8 Hidden Wastes – Part 3 of 8. The W in DOWNTIME
 Waiting wastes come from people, processes or partially finished goods sitting idle while waiting for instructions, information or raw materials. Poor scheduling, poor vendor support or communications and inaccurate inventories cause processes and people to come to a halt and cost valuable time and profit.
LOOK FOR idle people or machines waiting on the preceding or following operation, materials, schedules or information.
REDUCE BY Line Balancing (schedule balancing) workloads and using a Cycle Time/Takt Time Bar Chart for process synchronization.
Line Balancing is simply leveling the cycle time for all operations within a line or process. It is building the cycle time concept into the standardized operations of a production line for maximum efficiency. Line balancing smoothes work tasks and operator motions to create a harmonious and uninterrupted flow of product through the process steps. Workers learn to identify those processes that are out of balance with others and how to bring them back into line. While most companies assign the duties of measuring and improving production lines to process engineers, there ARE things that a team of line personnel can measure and examine for improvement opportunities. These people handle the process daily and understand the impact that balanced flow has on through-put, lead time to the customer and inventory levels, all of which play a very important role in the financial success of the organization.
Cycle time is the time that elapses from the beginning to the end of a process. It is the sum of all value-added processing time AND the all non-value added time.
Takt Time is an expression of your customer demand normalized and leveled over the time you choose to produce. It is not, and never has been, a pure customer demand signal. Customers do not order the same quantity every day. They do not stop ordering during your breaks, or when your shift is over. What Takt Time does do, however, is make customer demand appear level across your working day.
Using chart paper and a stop watch, record the time for each process or operation and the time for all steps or sub-processes. Record the minimum and maximum time for each step as it is completed by more than one operator.
This information can be used two ways. The first is to identify the number of workers and the duties each should accomplish to meet the changing demands of the customers. This information can be used to balance a production line for different levels of production and keep everyone informed. Another way this information can be used is to develop a Takt Time/ Cycle Time Bar Chart. Identification of the maximum and minimum individual process times within an operation points out the variation between the ways different operators complete their duties. Improvement teams can work on developing better SOPs and continued operator education to reduce this variation.
The average cycle time for each operation within a larger overall process needs to be shorter than the customer’s demand time or Takt Time. Analyze lengthy operations to see if there are small incremental sub-processes that can be moved to the operations with a shorter cycle time to help balance the line. Very few production lines will ever be 100% balanced. The goal should be a maximum variance of approximately 10%.
What are your customers and the improvement of your company’s bottom line Waiting for?
Watch for upcoming articles on Lean Manufacturing and the remaining Hidden Wastes of DOWNTIME…
Lean Manufacturing: Eliminating the 8 Hidden Wastes – Part 2 of 8. The O in DOWNTIME
 Many manufacturers believe in the traditional long runs of equipment because it is supposed to be more efficient to run a big batch versus running several shorter batches that include change-overs. Long runs require large inventories. Large inventories tie up large sums of money and keep our customers waiting longer. Thus, long runs reduce our ROI! Manufacturers that are leading their industries have found that when change-over times are drastically reduced and simplified, they can change-over more often and please more customers.
Over-Production waste occurs when we manufacture, assemble, or build more than what is needed. We make something just-in-case instead of Just-In-Time (JIT). Inaccurate scheduling, long lead times, long changeovers and not being close enough to our customers to understand their changing needs, leads us to longer production runs. We worry that our customer might need more while we have to suffer with the associated cost of unsold goods or services.
LOOK FOR processes producing more than is being “pulled” by the customer and requires storage between processes.
REDUCE BY improving Change-over and Set-up times and Line Balancing (Balancing Production Lines).
Quick Change-over and Set-up times on smaller and more flexible equipment make it easier to please many customers while reducing the overall cost of holding large quantities of inventory that is waiting for production opportunities. Drastically reduce change-over times requires an in-depth 2 step analysis and documentation of the process. The first step is to identify and move as many of the now internal (“power off”) activities to external (“power on”) activities. This first improvement step cost almost nothing to change, but are sometimes the hardest to implement because of years of old habits and resistance to change. The next step is to reduce the time required to perform the remaining internal activities. A valuable resource available on the subject is A Revolution in Manufacturing: The SMED System by Shigeo Shingo. His referral to SMED stands for Single Minute Exchange of Dies, and he believes the target for all change-overs should be 9 minutes or less. If you put together a cross-functional team from maintenance, operations, quality assurance and the tooling department (if it is separate from maintenance), the results can be amazing. These people have many ideas on how to improve change-overs and reduce the time required. They need to be empowered to suggest, plan and implement these improvements.
Line Balancing is simply leveling the cycle time for all operations within a line or process. It is building the cycle time concept into the standardized operations of a production line for maximum efficiency. Line balancing smooths work tasks and operator motions to create a harmonious and uninterrupted flow of product through the process steps. Workers learn to identify those processes that are out of balance with others and how to bring them back into line. While most companies assign the duties of measuring and improving production lines to process engineers, there ARE things that a team of line personnel can measure and examine for improvement opportunities. These people handle the process daily and understand the impact that balanced flow has on through-put, lead time to the customer and inventory levels, all of which play a very important role in the financial success of the organization.
What financial impact is Over-production having on your organization?
Watch for upcoming articles on Lean Manufacturing and the remaining Hidden Wastes of DOWNTIME…
Lean Manufacturing: Eliminating the 8 Hidden Wastes – Part 1 of 8. The D in DOWNTIME

Some waste exists in every system. From manufacturing and assembly, to hospitality, healthcare, transportation, and social services, some waste is hidden within all processes. Identifying and eliminating these hidden wastes saves millions of dollars every year for those organizations that have embraced and continuously use Lean assessments. These wastes fall into eight basic categories: Defects and rework, Over-production, Waiting, Non-utilized resources, Transportation, Inventory, Motion, and Excess processing. As listed here, the 8 wastes are most easily remembered using the acronym “DOWNTIME“.
Defect and rework waste happens when we do not have robust preventive systems that include Mistake Proofing, or Poka-Yoke, techniques. When we cause a defect or an error and pass it on to the next operation, or worse, pass it on to the customer, we are accepting rework as part of the process. We lose money when something is manufactured, assembled or serviced twice, while our customer will only pay us once for the goods or service.
LOOK FOR defective, partial or un-completed products or services and completed units that are re-worked or thrown away. Stacks and piles of items anywhere in the process are good indicators of waste.
REDUCE BY improving Visual Controls and initiating more complete Standard Operation Procedures. Implement Mistake Proofing or Poka-Yokes at the source or the place in the process where errors occur.
Visual Controls can help employees monitor the status of production or services at a glance and help to identify developing bottlenecks that will need to be cleared to keep operations running smoothly. Managers can keep employees at all levels informed of current production schedules, performance levels and accomplishments with large colorful Visual Controls. Worker assignments, qualifications, training levels and suggestions can be displayed to improve morale and give recognition using Visual Controls.
Standard Operation Procedures (SOPs) must be simple, user friendly and helpful tools, not unnecessary burdens. Inputs from all areas of the organization need to be formed together to supply all of the information required for doing the job correctly the first time. The ultimate goal of an SOP is to document the best way to perform a job for your situation of materials, equipment, location and people. The SOP should be written specifically for your situation. This will assure that you really are doing the work in the best way – at least until the next improvement come along.
Mistake Proofing, or Poka-Yoke, is the method of applying techniques to eliminate the possibility of errors occurring. Poka-yoke (poh-kah yoh-keh) or more literally avoiding (yokeru) inadvertent errors (poka) was coined in Japan during the 1960s by Shigeo Shingo, a pioneer of the Toyota Production System. Ideally, poka-yokes ensure that proper conditions exist before actually executing a process step, preventing defects from occurring in the first place. Where this is not possible, poka-yokes perform a detective function, eliminating defects in the process as early as possible. Workers, engineers and managers work together to establish procedures and design devices to prevent errors from occurring at their source of origin. The most economical and least costly time and place to detect and prevent errors is at the start of the process.
Can a substandard product or service be produced or performed and passed on to the next step in your processes?
Watch for upcoming articles on Lean Manufacturing and the remaining Hidden Wastes of DOWNTIME…
